
Detecting real hand-written digits with machine learning
Detecting real hand-written digits with machine learning
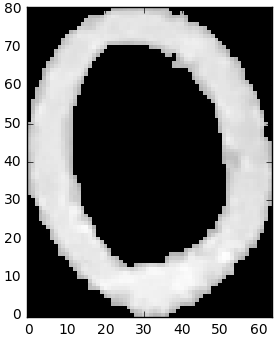
One of the first applications a novice machine learning student will encounter is the digit recognizer. It’s a really cool application, and a good demonstration of how machine learning can have real world applications. I think the visual aspect really strikes a chord with people too; a lot of machine learning examples are about making abstract predictions that have little tangible meaning, but in this case the results are clearly visible. However cool the digit recognizer example is, one thing that could be improved is showing its real world implications. In the digit recognizer problem we build a model that can detect hand-written digits, but this idea is never realized with actual hand-written digits. Here’s an example of a digit from the MNIST data set plotted as a grayscale matrix. For this particular data set, digits are represented as 28x28 single-byte grayscale values. The trouble is that they don’t really resemble hand-written digits.
Is there a way that we can use the models trained on MNIST data to accurately predict hand-written digits? It turns out that there is, and with only a little bit of image processing we can create a program that will detect our own hand-written digits, accurately and consistently.
I’ll include the code, but here’s the gist of it; it’s really not all that complicated:
- Train a logistic regression model on the MNIST data set using sklearn
- Draw and import our own hand-written digits
- Put the digits through a sufficiently general image processing pipeline that makes our digits more closely resemble digits from the MNIST set
- Use our trained model to make predictions on the hand-written digits
0. The data set
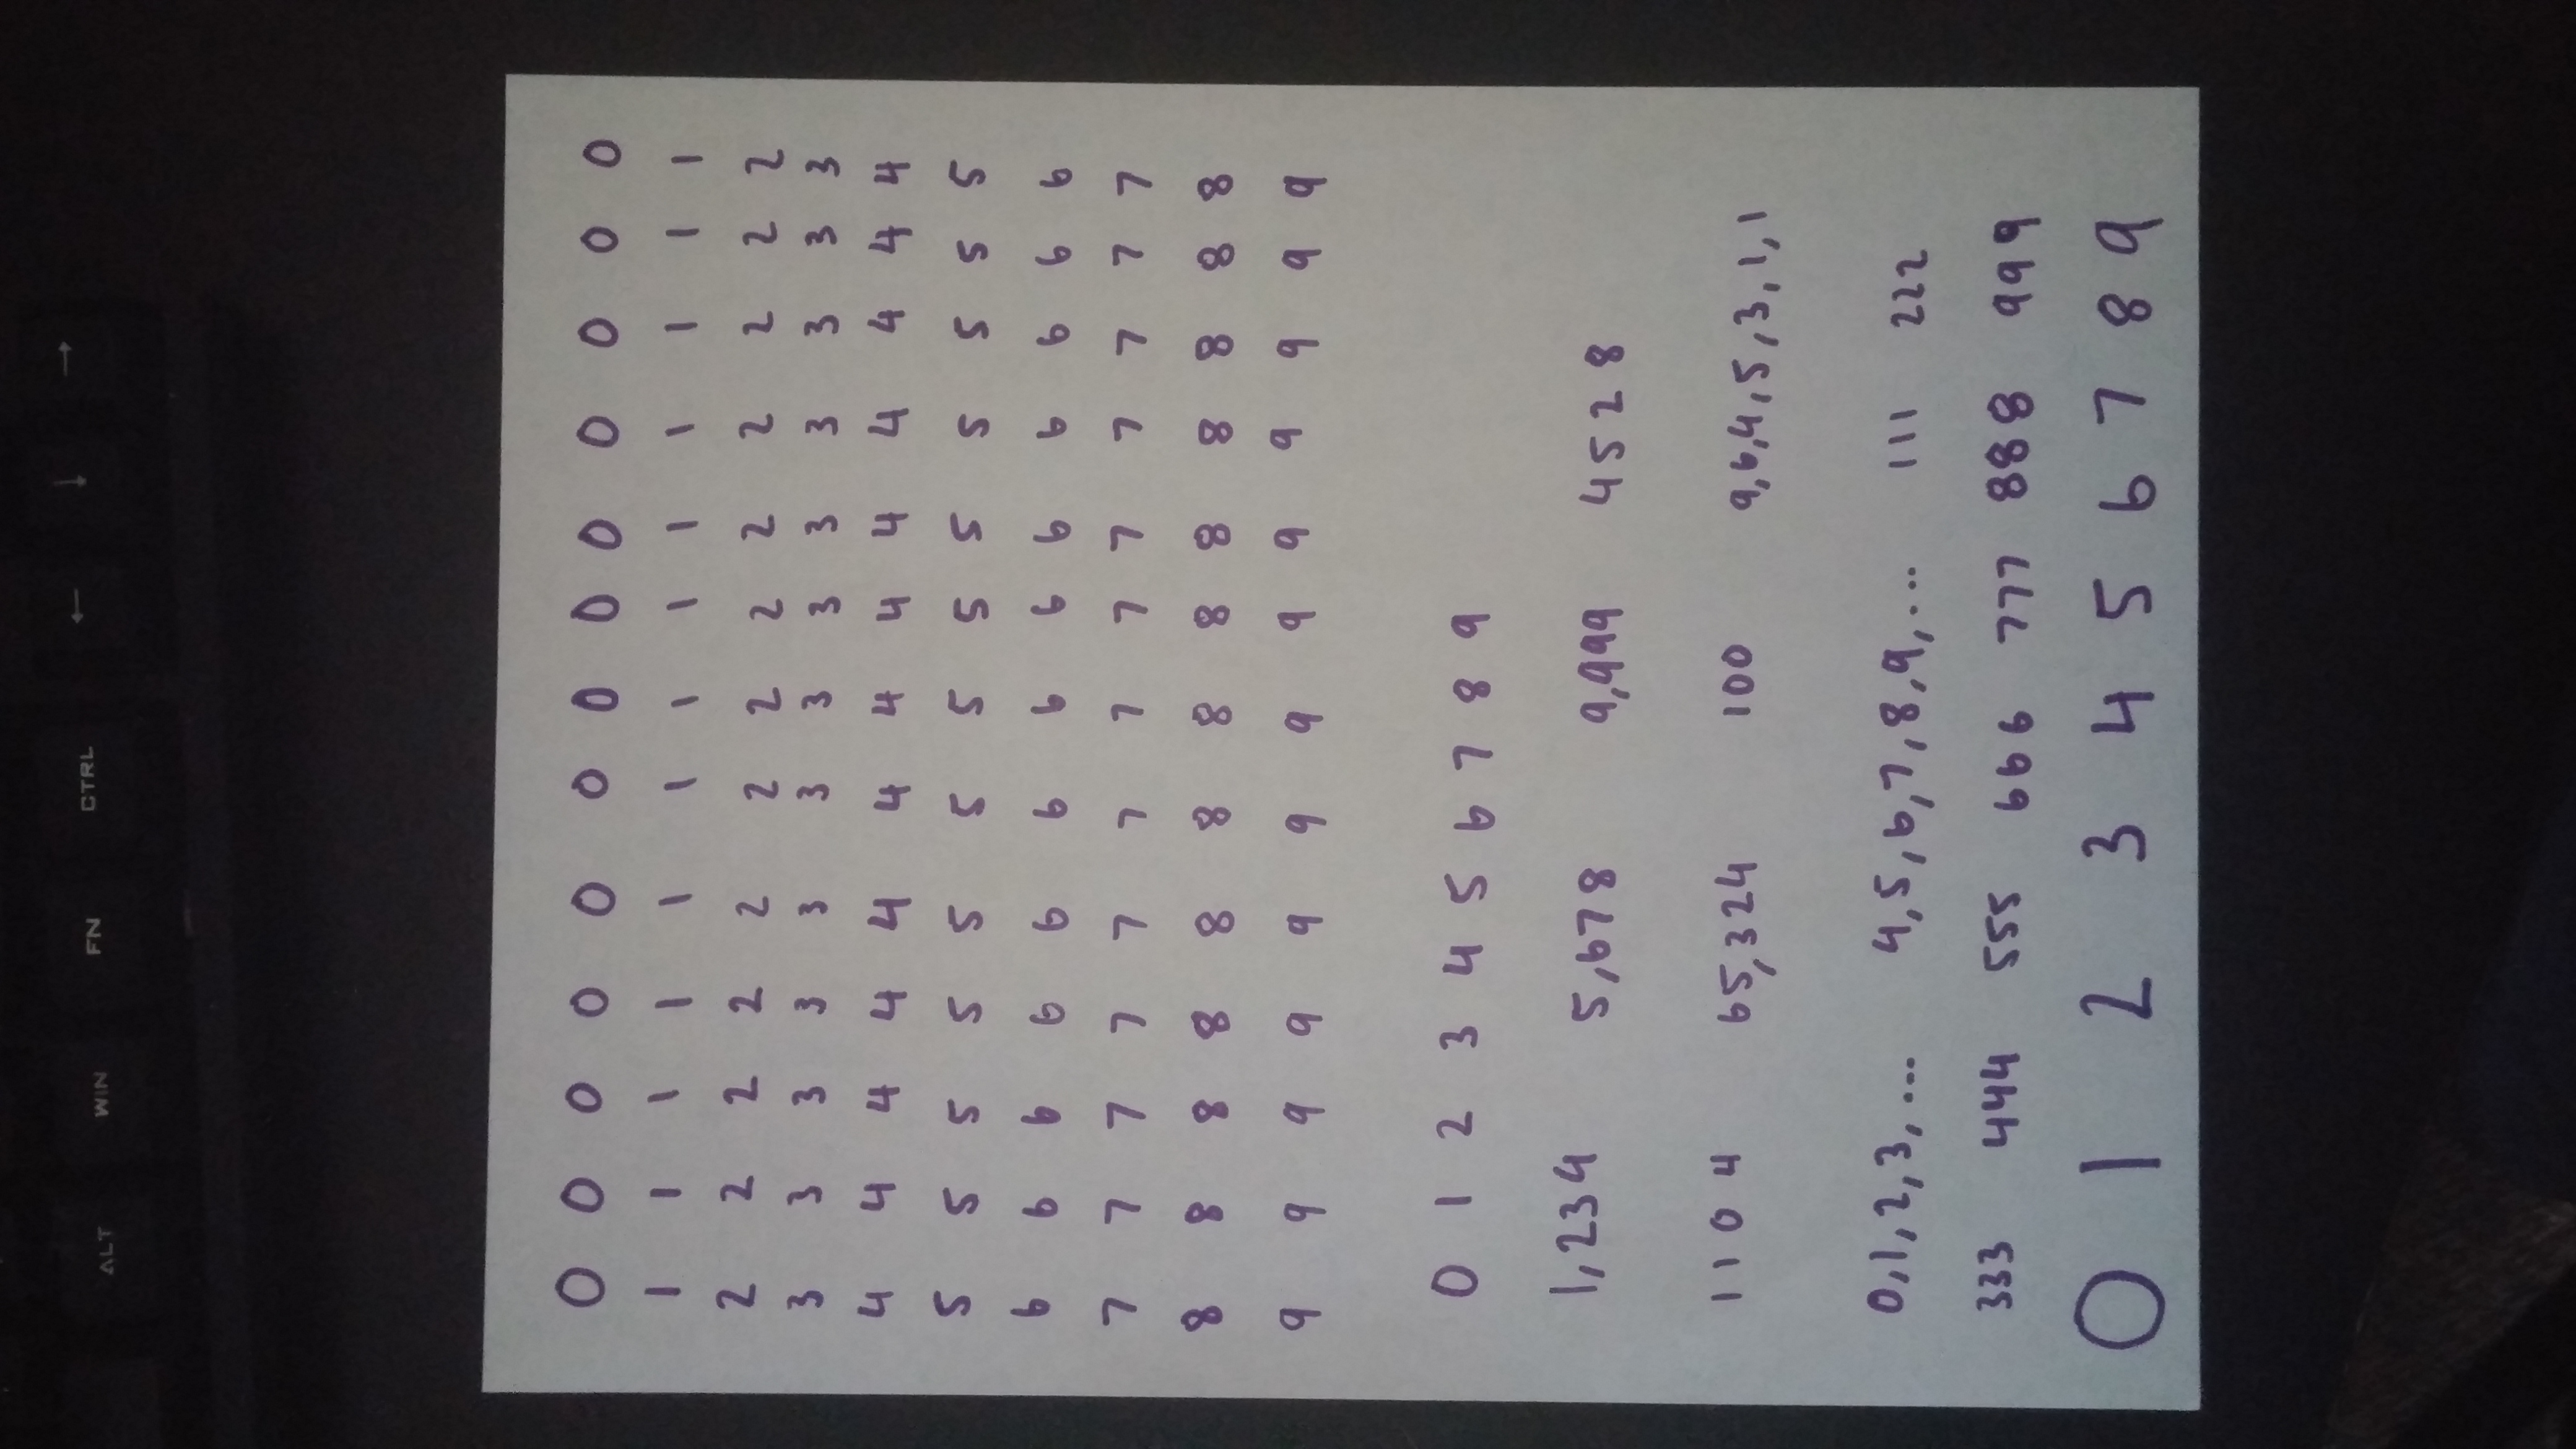
Here’s a picture of the raw image I’ll be using. It’s not a particular good picture, I quickly wrote down some digits using a marker I had lying around on a white sheet of paper, and snapped a quick overhead shot of the paper with my camera.
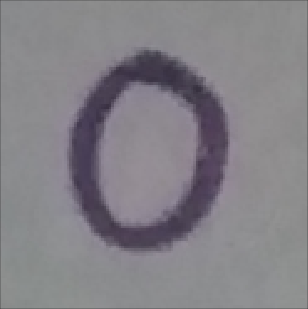
Here are two examples of single digits, on the left from the MNIST set and on the right, one of the zoomed in digits from the above picture. The goal is to make use of the thousands of the digits in the MNIST set to train a model to predict digits that start off looking like the hand-written digit on the right.

1. Image processing
Now that we’ve seen what the raw image we’re working with looks like, it’s clear we’ll have to process it in some way so that it more closely resembles the MNIST data. At the very least, we’ll have to rescale it to the size of the MNIST digits since the model will expect that many features. The image processing will be conducted in a number of steps, and at each step I’ll show a picture of the transformed image, a histogram of the pixel intensity in the transformed image, show a snippet of code containing the Python function used to perform that processing step, and finally explain my reasoning behind why that step was taken.
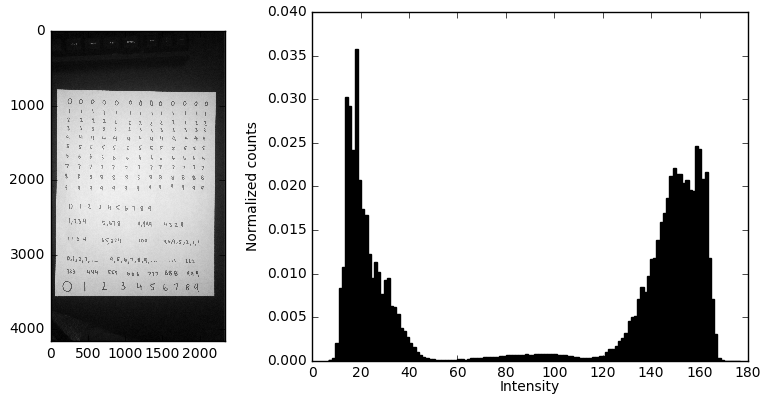
i. The raw image
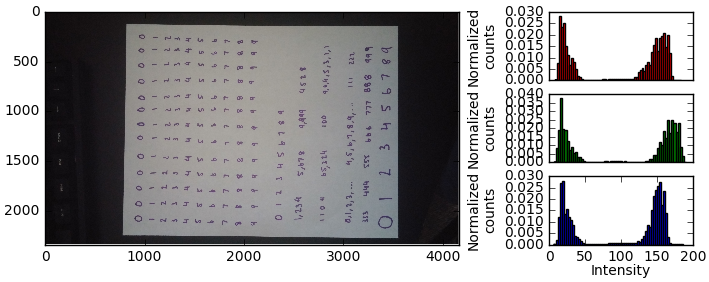
Couple things to point out. First, for whatever reason by default the image is rotated when loaded in via numpy. Second, while the image is actually RGB colored, you can see that it’s primarily black and white. The histogram doesn’t give us a ton of info here across the different color channels, aside from telling us that it’s approximately 50-50 black/white. Interestingly, the most prominent picture in the image is green, whereas one would expect it to be red and blue due to the purple represented in the digits.
To load the image, I snapped the .jpg picture, downloaded it on my computer, and used a convenient function contained in the matplotlib.pyplot module. This loads the image in as a numpy array.
import matplotlib.pyplot as plt
raw_image_file_path = './custom_digits.jpg`
raw_image = plt.imread(raw_image_file_path)
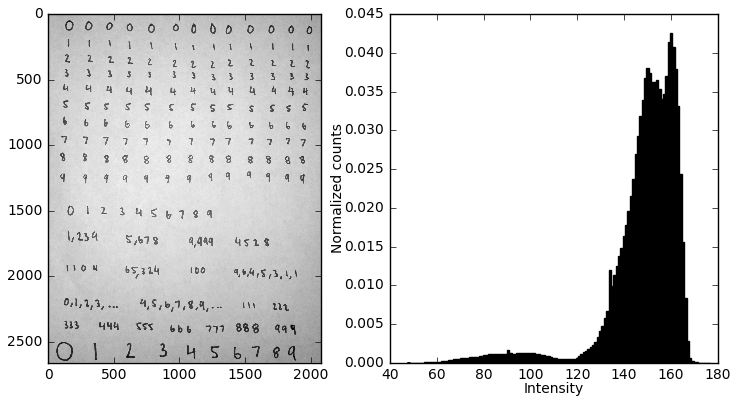
ii. Convert to grayscale
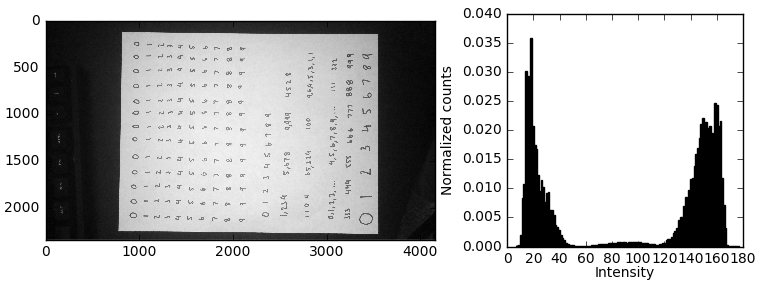
This is a simple grayscale conversion created by averaging the intensity across RGB channels, necessary since the MNIST set is grayscale valued. We use the np.mean() function to do this.
import numpy as np
processed_image = np.mean(raw_image, axis=2)
iii. Rotation
Since the camera was loaded in turned at an angle, we have to rotate it by $90^{\circ}$. I didn’t take the image with much care, so we can see that the picture itself isn’t even aligned with the $x,y$ axes of the figure. In principle I could perform an additional rotation so the digits are perfectly vertically and horizontally aligned, but I think this should do a good enough job for now.
processed_image = np.rot90(processed_image, k=-1)
iv. Crop out the background
Next we have to get rid of all that background. This could be done in an eloquent way, but for now I’m achieving the cropping step by manually slicing the numpy array.
x0 = 100
x1 = 2180
y0 = 850
y1 = 3510
processed_image = processed_image[y0:y1,x0:x1]
v. Invert the grayscale values
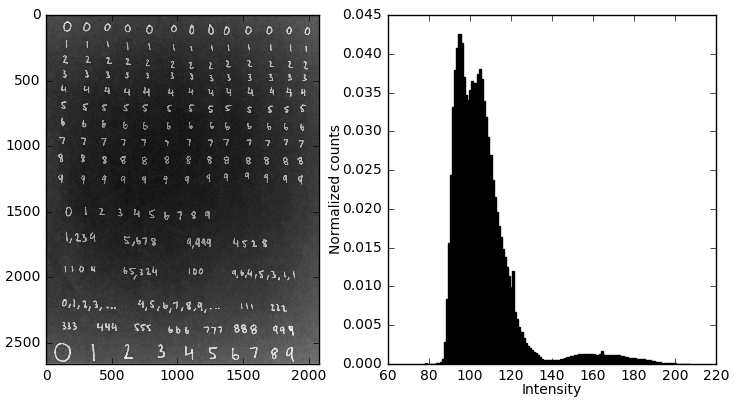
As we can see, in the MNIST set the digits themselves are whitish colors, while the background is pitch black. To adapt our image to this representation, we simply invert the grayscale values. This is easily achieved in numpy.
processed_image = 255 - processed_image
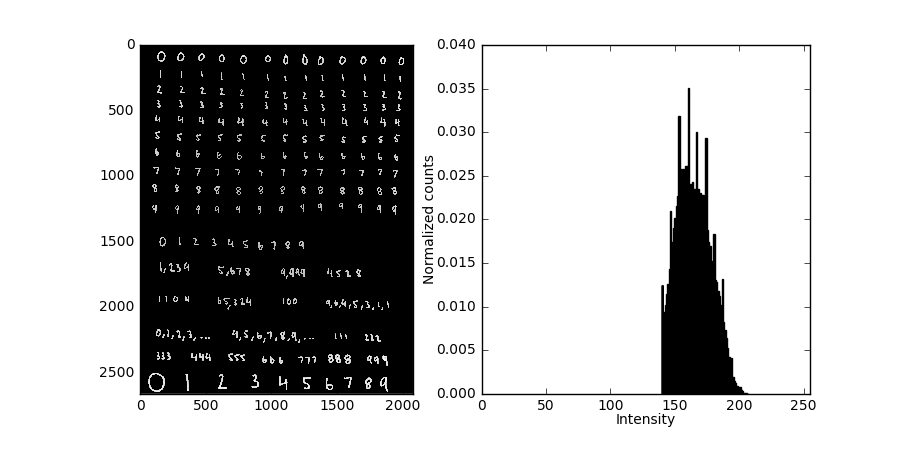
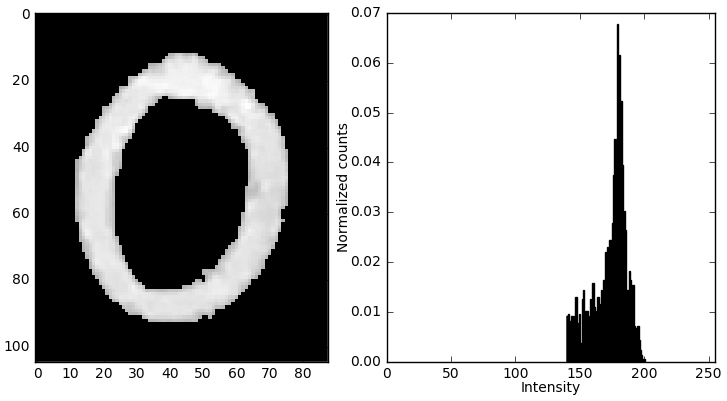
vi. Threshold the grayscale values
After inversion we’re starting to get an image that more closely resembles the MNIST set, but we can see that the background in the inverted image isn’t perfectly black. In order to make it so, we need to threshold the pixel intensities, basically by setting all pixels with intensity below the threshold value equal to zero (perfectly black). But, how do we choose the threshold? This is probably the first instance where the histogram is actually useful beyond just being informative. We can see two subpopulations in the histogram, a huge clustering of pixels at low intensity that corresponds to the background, and a much smaller sub population at higher intensities that corresponds to the letters. The goal is to move that entire mass of dark pixels to zero intensity. There are ways of being more exact about this, but I’m just going to do it by eyeballing the histogram in the previous step and setting the threshold based off of the gap between the populations of dark and light pixels. In this case, I went with 120.
Here’s the code. Notice how easy this operation is in numpy.
threshold = 120
processed_image[processed_image < threshold] = 0.
Note: In the following histogram I neglect to include black pixels from now on, since they dominate the pixel intensities at this point and make it difficult to see the high-intensity pixel bins.
vii. Isolate the digits
So far the image processing steps have taken us to a point where the individual digits begin to look more and more like the MNIST digits, but we still need to isolate individuals. How do we do this? The method I use is a variation of the flood fill algorithm. You know that paint bucket tool that’s in virtually every image manipulation software program? That thing uses flood fill. Basically, we are looking for non-black pixels, and every time two of these pixels touch sides, we group them together. We recursively add neighboring pixels into the cluster, until eventually we’ve scanned over the entire image. After flood fill, we have a list of clusters, where each cluster itself is a list of the indices of the pixels that belong to that cluster. Then, for each cluster I create a new numpy array for that cluster. All of the pixels in this array are black, except for the pixels that were included in that particular cluster which retain their intensity value.
To show how this works, I’m including a transformed version of the original image where cluster is assigned a random color. This demonstrates how neighboring pixels are indeed clustered correctly.
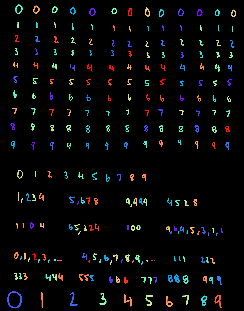
The picture above indicates that the clusters were properly detected, and the following image shows the transformation that is performed on each cluster.
Now we’re at the single digit level, and for the rest of the tutorial we’ll be performing transformations on the individual digits instead of the entire bulk image as we have up to this point.
As for the coding part, I’m 99% sure that somewhere out there in Python’s scientific computing space there’s a single-call flood fill function, but I’ve yet to find it. It’s probably in numpy, scipy, opencv2, or maybe even in matplotlib. A quick google search didn’t find it for me, so I just decided to implement it myself. It’s not so tricky, but it’s a recursive algorithm so you have to be a little careful to avoid having your code blow up ;)
# List of clusters
# Each cluster is a list of pixel indices that belongs to that cluster
clusters = FloodFill(processed_image)

# Turn the clusters of pixels into single digit images
digits = []
for cluster in clusters:

    # Create an empty numpy array that is as tall and wide as
    # the span of the pixels in this particular cluster
    digit = np.empty((np.max(cluster[:,0]), np.max(cluster[:,1])))


    # Set the intensity value of the pixels in the digit
    # to the intensity value of the pixels in the cluster.

    row_offset = np.min(cluster[:,0])
    column_offset = np.min(cluster[:,1])

    for pixel in cluster:
        digit[pixel[0] - row_offset, pixel[1] - column_offset] = processed_image[pixel[0], pixel[1]]

    digits.append(digit)
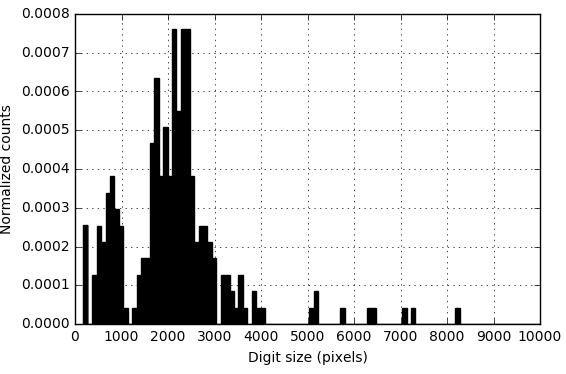
viii. Threshold digits based on pixel count
The general image processing pipeline we’ve gone through so far generally works, but on occasion you’ll have errant small clusters that get picked up and recognized as digits. In this case, I had commas and periods on the page that have been put into clusters that I don’t want to make predictions on, but you could also have small stray marks on the page or noisey pixels left over as an artifact from one of the previous processing steps. This filtering step may be complex depending on the ‘noise’, or undesired objects, in your own personal images. In this case, we filter out the undesired characters by simply applying a filter on the minimum number of pixels that a digit must have, since we know the commas and periods are smaller than the digits we’re interested in.
How do we choose the threshold value? One easy way is to plot a histogram of the pixel counts of all the digits. There should be a small subpopulation of digits with lower pixel values than others. In my case,
Here’s what the histogram looks like.
ix. Pad the digits
Next, we see that the light pixels run all the way up to the border of the image, whereas in the MNIST set this never happens; usually there’s a border of a few black pixels surrounding every image. What we have to do is ‘pad’ our digits, basically adding some amount of black space around them. Now, the * amount * of padding matters. I inserted random pads until I found something that qualitatively matched the appearance of the MNIST digits.
Now for the code… Guess what? There’s a numpy function that will do the for us in a single line of code! Who would have thought? Simply amazing. All we have to do is specify the number of pixels we wish to pad with, which I choose based on a percentage of the total height of the digit. This same padding is applied at all sides on the entire image.
def PadDigit(digit, pad_percentage):
    digit_height = digit.shape[0]
    pad_size = int(digit_height * pad_percentage)
    processed_digit = np.pad(digit, pad_size, 'constant')
    return processed_digit
x. Resize the image
Last image processing step! We have to ensure that our images have the same number of features as the MNIST set which we’ll be training on. How do we go about resizing the image? One way we could do it is via some 2D interpolative method, where we generate 28x28 pixels based on the expected value at that point. Or, we could do something like a 2D averaging kernel. Fortunately, numpy again saves this trouble by providing the numpy.resize() function.

We can actually train now because our input is the correct size. Notice that using the numpy.resize() function provided an additional benefit by increasing the granularity of the digit, making it more closely resemble the digits from the MNIST set.
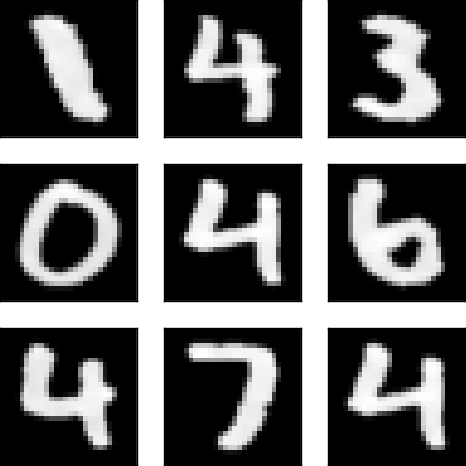
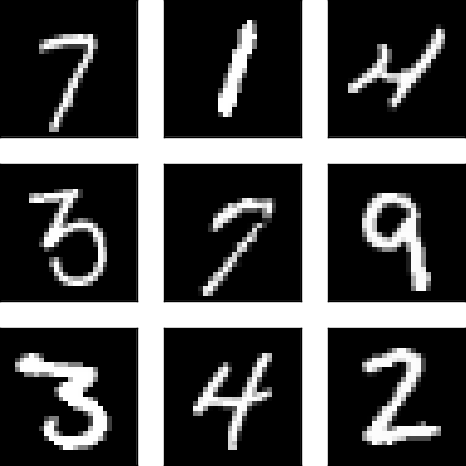
2. Reviewing the processed images
Below I have a random sampling of images taken from the custom digits after processing and from the MNIST set. Now, clearly the MNIST set was written with a pen instead of a marker. Our digits are a little fatter. However, other than that they’re pretty darn similar. Let’s see how it works out!
3. Model training
Phew. Finally we’re on to the machine learning part of this thing. First we’ll load the data set, then we’re going to use the LogisticRegression class from the sklearn.linear_model module to train a logistic regression model. If you’ve used sklearn before, you know how easy this is. Here’s the code (including the loading part):
# Load data
file_path = './mnist_digits.csv'
data = np.genfromtxt(file_path, delimiter = ',')

# Split into features/outputs
X = data[:,1:]
y = data[:,0]

# Create and train the model
model = sklearn.linear_model.LogisticRegression(C=1e10)
model.fit(X, y)
Easy peasy. I should note that I didn’t want to use regularization here, so I set C to an arbitrarily large number so that the feature weights weren’t penalized at all.
4. Model testing
Ok, now the part we’ve been waiting for. I’ll go over the model’s predictions, its accuracy on each of the digit types, and uncover any underlying trends that I find.
4. Testing the model!
Now that we’ve trained our model and preprocessed hte images, let’s feed them into our model!
comments powered by Disqus